Optimizing the Gap – Enhancing Efficiency and Effectiveness
This is the second paper on Analytics-Driven Workforce Planning. The first paper covered how to forecast a multi-year talent gap that is directly tied to the organization’s strategic objectives. This paper will describe how we optimize that talent gap for enhanced workforce efficiency and organizational success.
What is Meant by Optimizing the Gap?
“Optimizing the Gap” represents a crucial step in workforce planning beyond our initial gap analysis. While our earlier efforts quantified the overall number of people needed—like pinpointing the requirement for 100 engineers over the next five years—optimization delves into the finer details. This phase goes beyond simply counting heads to strategically determining the mix of expertise needed within the workforce. It’s about building the right team, not just about making sure we have enough people. By sorting our needs into categories—new grads, folks with some experience, and industry veterans—we create a workforce that’s not only diverse in its skills but also balanced in its ability to innovate and execute. It’s about making sure we’ve got both fresh perspectives and seasoned wisdom in the room, matching the right levels of experience to the right projects. Thus, “Optimizing the Gap” is where analytical foresight is transformed into strategic action as the critical bridge between identifying a gap and effectively filling it to foster an environment of growth, innovation, and sustained competitive advantage.
Three Requirements
Three distinct requirements are essential to optimizing the gap. Each requirement serves a unique function in mapping out the structure and effectiveness of our future workforce.
1. Histogram of Employee Experience Demographic
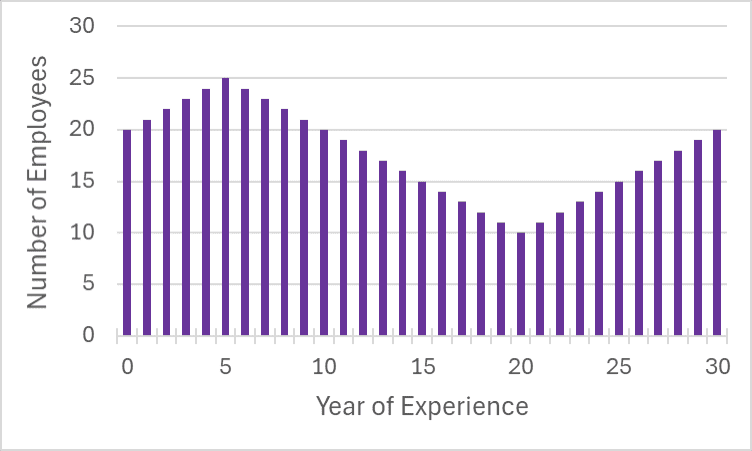
The first requirement is a histogram, which is essentially a bar graph that represents the frequency of data points in various categories. For our purposes, this histogram will display the number of employees categorized by years of experience. This visual representation helps us understand the current composition of our workforce—highlighting, for instance, whether we have a predominantly young workforce or a deeply experienced one. It sets the stage for strategic hiring by showing where there are gaps in experience that need to be filled. Below is an example of what an employee experience histogram might look like.

2. Productivity Curve by Years of Experience
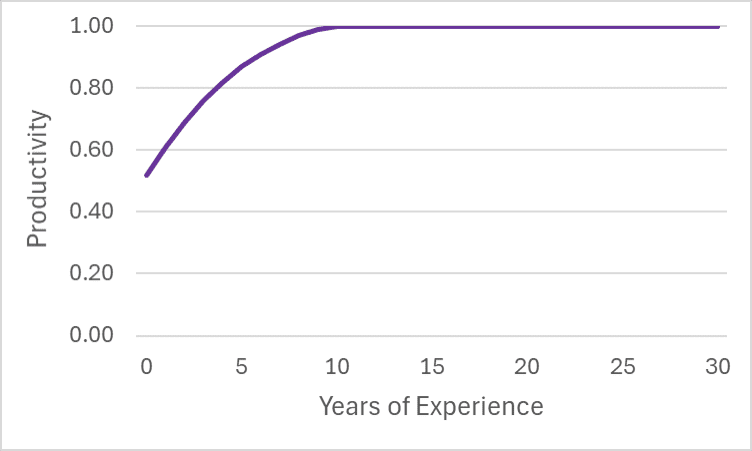
The second requirement is a productivity curve, which plots the typical progression of employee productivity as they gain more years of experience. This chart can be created in many ways (e.g. using compensation levels to gauge productivity, actual productivity requirements at certain levels, etc.). Below is an example of what a productivity curve might look like.

If you know your employee experience demographic (requirement #1) and have established an accepted productivity curve, you know exactly what overall productivity looks like today in your organization (the total sum of the multiplications of employee experience and number of employees at that experience level). This current level of overall productivity is the starting point for requirement #3.
3. Linear Programming Model
The third requirement is a linear programming model. Linear programming is a mathematical method used for optimizing a particular outcome based on given constraints, which in our case, involves calculating the most efficient distribution of different experience levels within the workforce. By starting with our current overall productivity from requirement #2, and using our growth projections (from the previously discussed gap analysis), and incorporating any necessary constraints, this model will provide the optimal solution for hiring across various experience levels. The term “linear programming” may sound complex, and possibly intimidating, but this can actually be created relatively simply even in applications like Microsoft Excel.
Intended Output
The goal of optimizing the gap is to determine how many people, at various experience levels, we need to fill the forecasted talent gap. If we know the organization’s talent gap (as discussed in the first paper), know the organization’s experience demographic, know the organization’s productivity curve, we can then create an optimized solution that shows us how many new, mid-career, and later-career people we need to hire. This allows our Talent Acquisition teams to be much more proactive in their recruitment efforts, allows our Talent Management teams to be much more strategic in how we develop people, and can, oftentimes, dramatically level out our employee experience demographic, thereby ensuring a steady, consistent talent pipeline for years to come.
Feel free to reach out if you would like to discuss how to use these tools to optimize your talent gaps!


